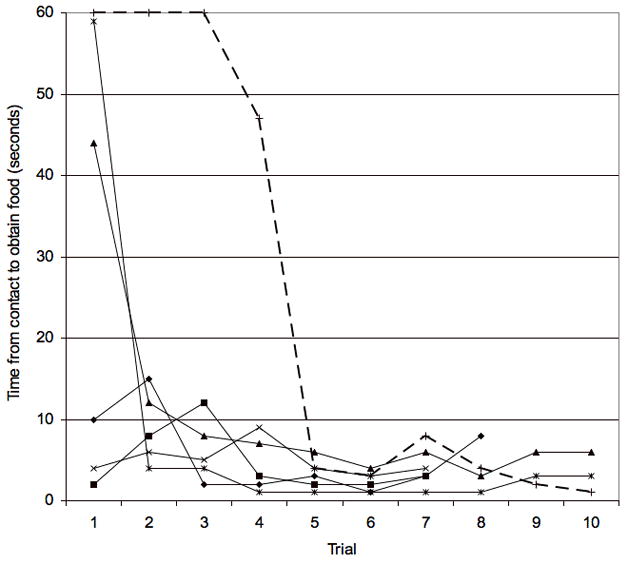
Figure 3.

Learning curves for the initial isolation of individual capuchin test subjects. The lines show the first isolation in which the subject obtained food reward. Solid lines are individuals tested with Apparatus 1; dashed line is with the individual that solved Apparatus 2.
