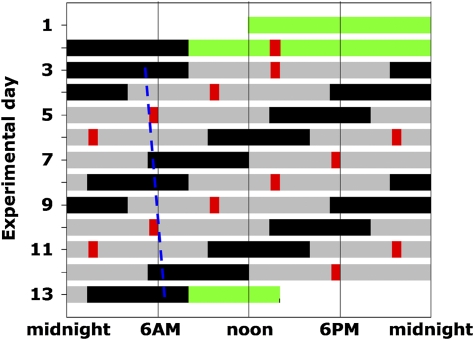
Fig. 1.
Forced Desynchrony Protocol. Solid back bars, scheduled sleep (0 lux); gray bars, wakefulness in dim light [≈1.8 lux (≈0.0048 W/m2)]; green bars, baseline days and discharge day in normal room light (≈90 lux); red bars, test batteries; dashed blue line, illustration of trajectory of circadian CBTmin throughout the FD protocol (circadian period of 24.09 ± 0.06 h in these subjects).

