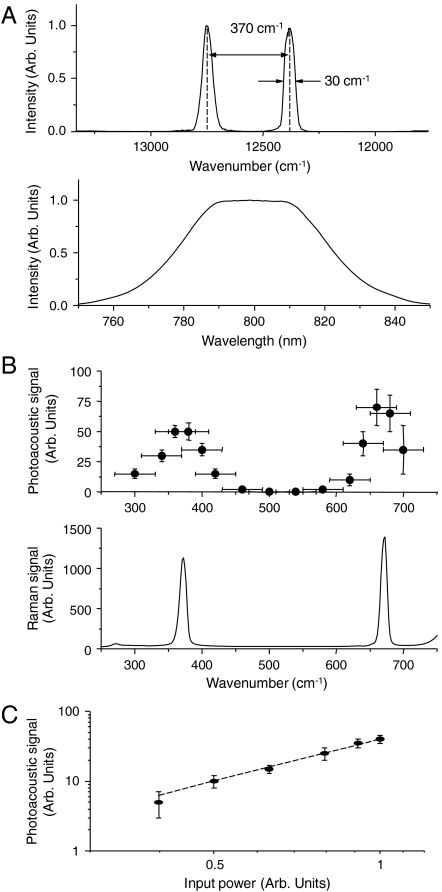
Fig. 3.
(A) Lower: output spectrum from the amplified Ti:sapphire laser; upper: shaped spectrum resulting in a strong PA signal from chloroform; (B) lower: Raman spectrum of neat chloroform (spectral resolution 3 cm-1); upper: stimulated Raman PA excitation spectrum of neat chloroform (spectral resolution 50 cm-1 is determined by the excitation line-width and is shown as a horizontal error bar); (C) the amplitude of stimulated Raman PA signal as a function of the input power: circles—experiment, dashed line—quadratic dependence.

