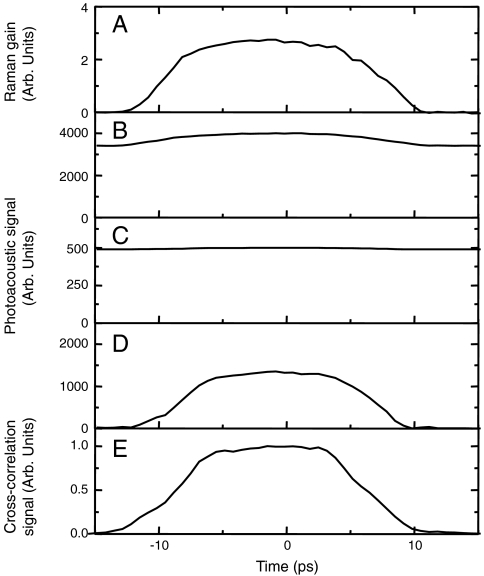
Fig. 6.
(A) The increase of the intensity of the Stokes beam as a function of the time delay between the pump and Stokes pulses; (B) the PA signal as a function of the time delay between the pump and Stokes pulses; (C) the same as (B), but the incident power of the beams is reduced by a factor of seven (the PA signal due to the simultaneous action of two pulses is almost invisible due to the linear absorption background); (D) the same as (C), but the signal is measured by taking the difference between the actual value at a given time delay and the PA signal taken at a large enough time delay, when there is no overlap between two pulses; (E) cross-correlation function of the pump and Stokes beam measured by the sum-frequency generation in a nonlinear crystal.

