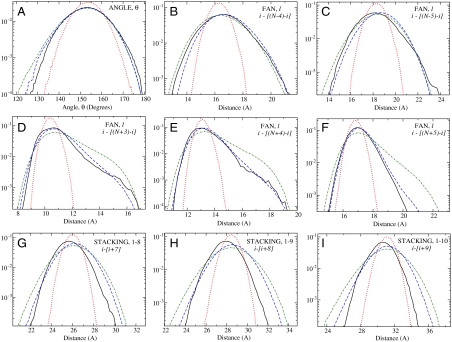
Fig. 2.
Semilog plots for some of the DNA structural distributions: (A) bending angle; (B–F) several of the fan constraints (notations are explained in the caption of Fig. 1); (G–I) some of the intrastrand distances (1–8, 1–9, and 1–10 stacking interactions) between DNA particles separated by seven, eight, and nine nucleotides, respectively. Solid black (reference AA), red dotted (initial CG), and blue dashed lines (MRG-CG optimized) structural distributions were obtained from the corresponding simulations. Additionally, wider distributions that have been generated by uniformly rescaling the optimized CG Hamiltonian by 0.7 are shown as green dash-dotted lines (see the text). Note that there are no physical constraints imposed on the DNA chain that correspond to stacking interactions; i.e., they do not enter into the CG force field. However, the last three panels indicate that these (and other) structural distributions are still reasonably well-reproduced.

