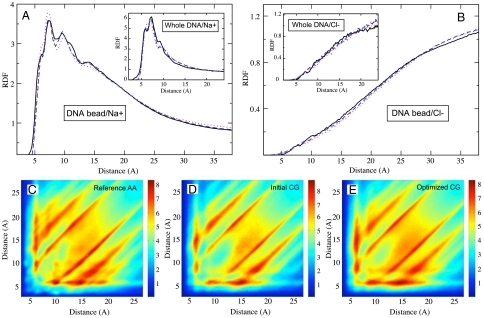
Fig. 3.
Distributions of mobile ions around DNA are plotted. The Upper panels show one-dimensional RDFs for Na+ (A) and Cl- (B) ions around a single DNA bead (main panels) and the whole DNA chain (Insets); line coloring is the same as in Fig. 2. (C–E) The Lower panels show two-dimensional RDFs for Na+ ions defined by two distances between the mobile ion and two different beads of DNA; it is seen that agreement with the reference AA distribution is improved after the MRG-CG optimization (see the text).

