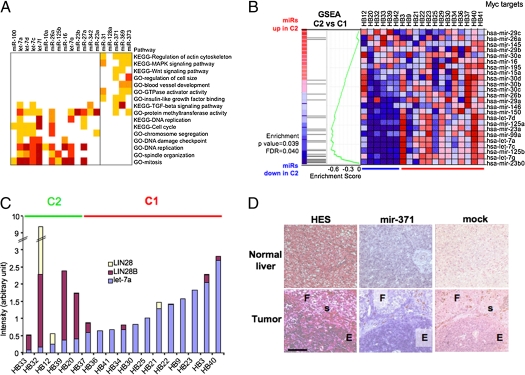
Fig. 2.
Specific miR profiles in two HB subtypes. (A) Comparative analysis of gene and miR expression in HB molecular subclasses. For each miR differentially expressed between C1 and C2 HBs, genes with negatively correlated expression profile (r < −0.45) were filtered with candidate miR targets defined by four predictive algorithms. Functional modules or pathways significantly associated with miR-related gene lists are shown as a heat map. Dark yellow, P < 0.05; orange, P < 0.01; light red, P < 0.005; dark red, P < 0.001. (B) GSEA analysis of HB miR data with a list of miRs repressed by Myc, visualized as a heat map in which the red to blue color code indicates high to low miR expression. FDR, false discovery rate. (C) Analysis of let-7, LIN28, and LIN28B expression in HB samples by qPCR. Each bar represents juxtaposed normalized data of gene and miR expression. (D) ISH assay on paraffin-embedded HB and liver samples. F, fetal; E, embryonal; s, siderophage foci. (Scale bar, 100 μm.)

