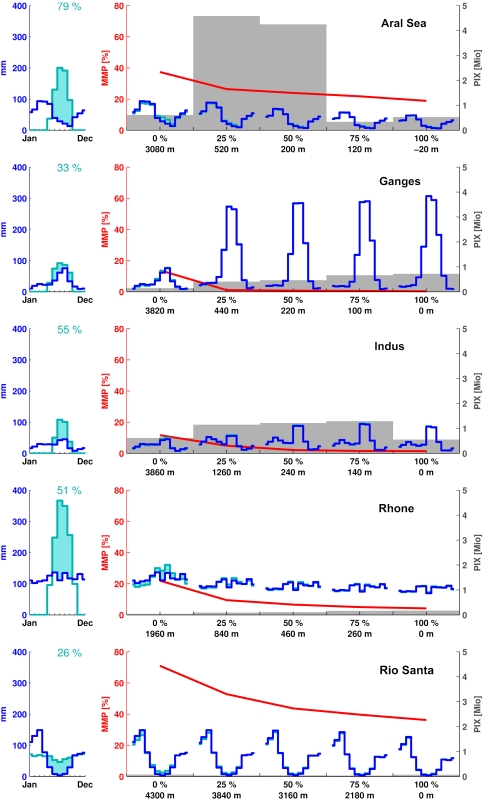
Fig. 1.
Left column: Monthly mass budget of the glacierized area, derived from CRU climatological data. Shown are monthly accumulation onto the glacier surface (dark blue), monthly ablation (light blue), and seasonally delayed runoff from glaciers (blue shading). Numbers at top center are the percentage of annual precipitation on the glacier that runs off as seasonally delayed melt water. Right column: Effect of seasonal delay on water input as a function of the altitude, starting at the altitude of the lowest glacier tongue and ending at the river’s estuary. Lower limits zi of the altitude bands are given together with the percentage of total basin area (increasing from 0% at the altitude of the lowest glacier tongue to 100% at the river’s estuary). Shown are the climatological mean annual variation of precipitation above zi (Pz, dark blue), seasonal modification of Pz by glacier storage and release (light blue), MMP (red), and PIX (gray bars).

