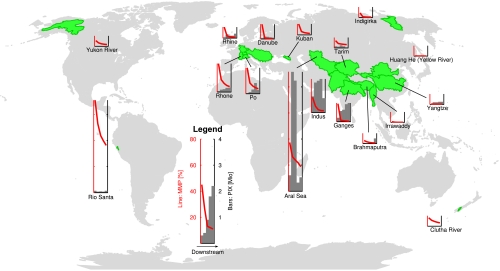
Fig. 2.
World map showing the location (shaded green), MMP (red lines), and PIX (gray bars) of each of the river basins considered in this study. The horizontal axis of the small plots is the same as in Fig. 1, Right column. The vertical scale of the small plots is held constant. Numeric values are provided in the SI Appendix.

