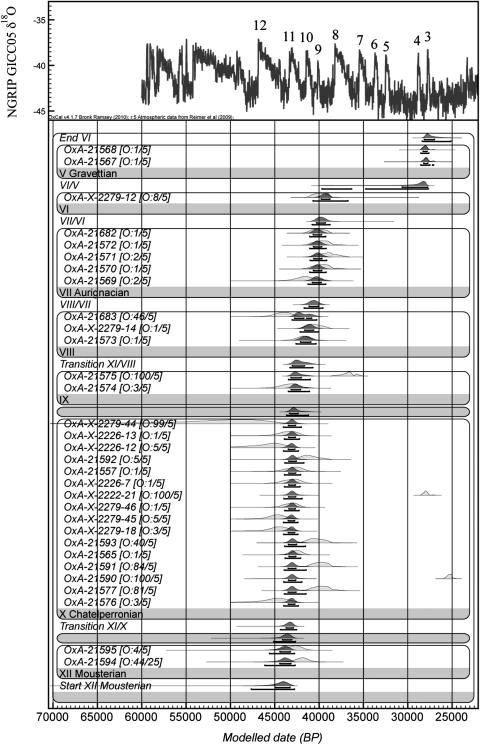
Fig. 2.
Bayesian model for the radiocarbon dates obtained at the Grotte du Renne sequence. This model was generated using OxCal 4.1 (24) and the INTCAL09 calibration curve (21). The model is built based on the known stratigraphic sequence for the site, and the data are divided into phases. There are a large number of outliers in the Châtelperronian levels (Table S4). Lighter shaded distributions are calibrated radiocarbon likelihoods, whereas darker outline distributions are posterior probabilities after modeling the sequence. The outlier posterior and prior probabilities are given in brackets next to the OxA- and OxA-X numbers. The data are compared with the North GReenland Icecore Project (NGRIP) δ18O climate record (31, 32).

