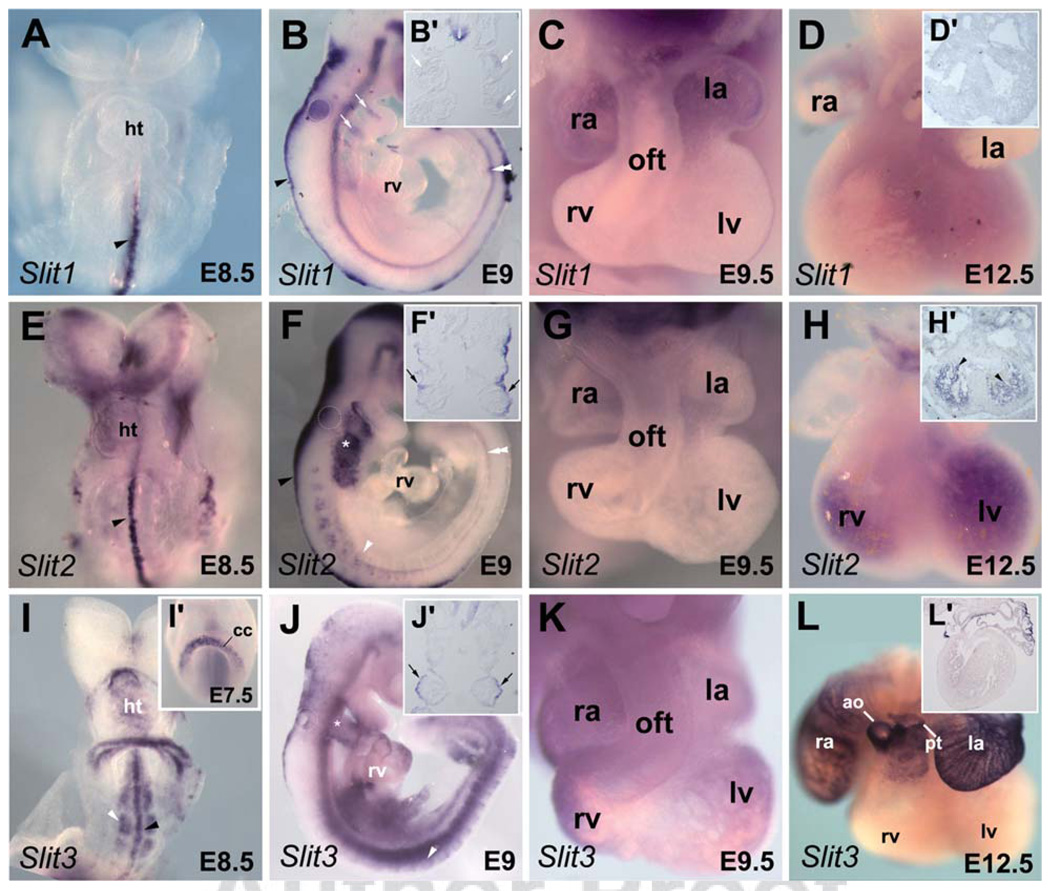
Fig. 1.
Expression pattern of Slit genes during embryonic heart development. Whole-mount in situ hybridization analysis of embryos with Slit1 (A–D), Slit2 (E–H), and Slit3 (I–L) probes. A: Ventral view of embryonic day (E) 8.5 embryo showing Slit1 expression in the ventral midline (arrowhead). Slit1 is not detected in the forming heart tube. B: Lateral view of E9 embryo showing Slit1 expression in the roof plate (arrowhead), in the floor plate (double arrowhead), and the pharyngeal region (white arrows). B′: Frontal section (same embryo depicted in B) showing Slit1 expression in the mesodermal core of the pharyngeal arch (white arrows) and in the floor plate of the spinal cord. C: High magnification picture of heart at late E9.5 showing Slit1 in atrial wall. D: Dissected E12.5 heart showing no expression of Slit1. D′: In situ hybridization with Slit1 on section of E12.5 heart. E: Slit2 was not detected in the heart of embryo at E8.5 stage. Note its expression at the ventral midline (arrowhead). F: Lateral view of early E9.5 embryo showing Slit2 expression in the pharyngeal region (asterisk). Slit2 is also detected in the roof plate (arrowhead), the notochord (double arrowheads) and the somites (white arrowhead). F′: Frontal section (same embryo depicted in F) showing Slit2 expression in the pharyngeal ectoderm surface (arrows). G: Dissected E9.5 heart showing no expression of Slit2. H: A robust expression of Slit2 is detected in trabeculae of both ventricles at E12.5. H′: In situ hybridization on section of E12.5 heart shows expression in the trabeculae (arrowhead). I,I′: Ventral views of E7.5 and E8.5 embryos showing Slit3 expression in the cardiac crescent and the forming heart tube. Expression of Slit3 is also detected in the ventral midline (black arrowhead) and the somites (white arrowhead) of E8.5 embryo. J: Lateral view of early E9.5 embryo showing Slit3 expression in the heart and the pharyngeal ectoderm surface (asterisk) and in the somites (white arrowhead). J′: Frontal section (same embryo depicted in J) showing expression of Slit3 the pharyngeal ectoderm surface (arrows). K: High magnification picture of the heart at late E9.5. Expression of Slit3 is seen in the outflow tract, the atria and ventricles of the embryonic heart. L: At E12.5, expression of Slit3 is maintained in the right and left atria and in great arteries, the aorta and pulmonary trunk. L′: Section of the heart shown in L. ao, aorta; cc, cardiac crescent; ht, heart tube; la, left atrium; lv, left ventricle; oft, outflow tract; pt, pulmonary trunk; ra; right atrium; rv, right ventricle.

