
Figure 3.
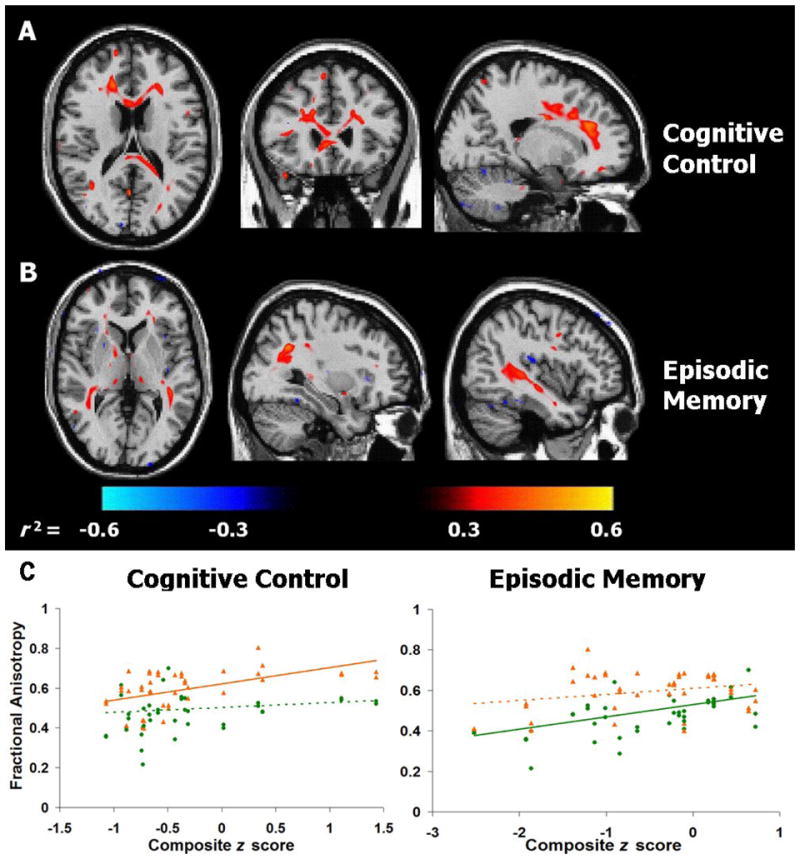
Voxel-wise signed-r2 maps for correlations between FA and composite scores on A) cognitive control tasks, and B) episodic memory tasks in OA. Positive correlations are shown in red, negative correlations in blue. C) Composite z scores on cognitive control and episodic memory tasks plotted against mean FA for frontal (▲, orange lines) and temporo-parietal (●, green lines) ROIs, bilaterally (see text for anatomical definitions). Significant correlations (p < 0.01) are indicated by solid lines, non-significant correlations by dashed lines. Due to the similar patterns of correlation, right and left ROIs are combined for graphical purposes.