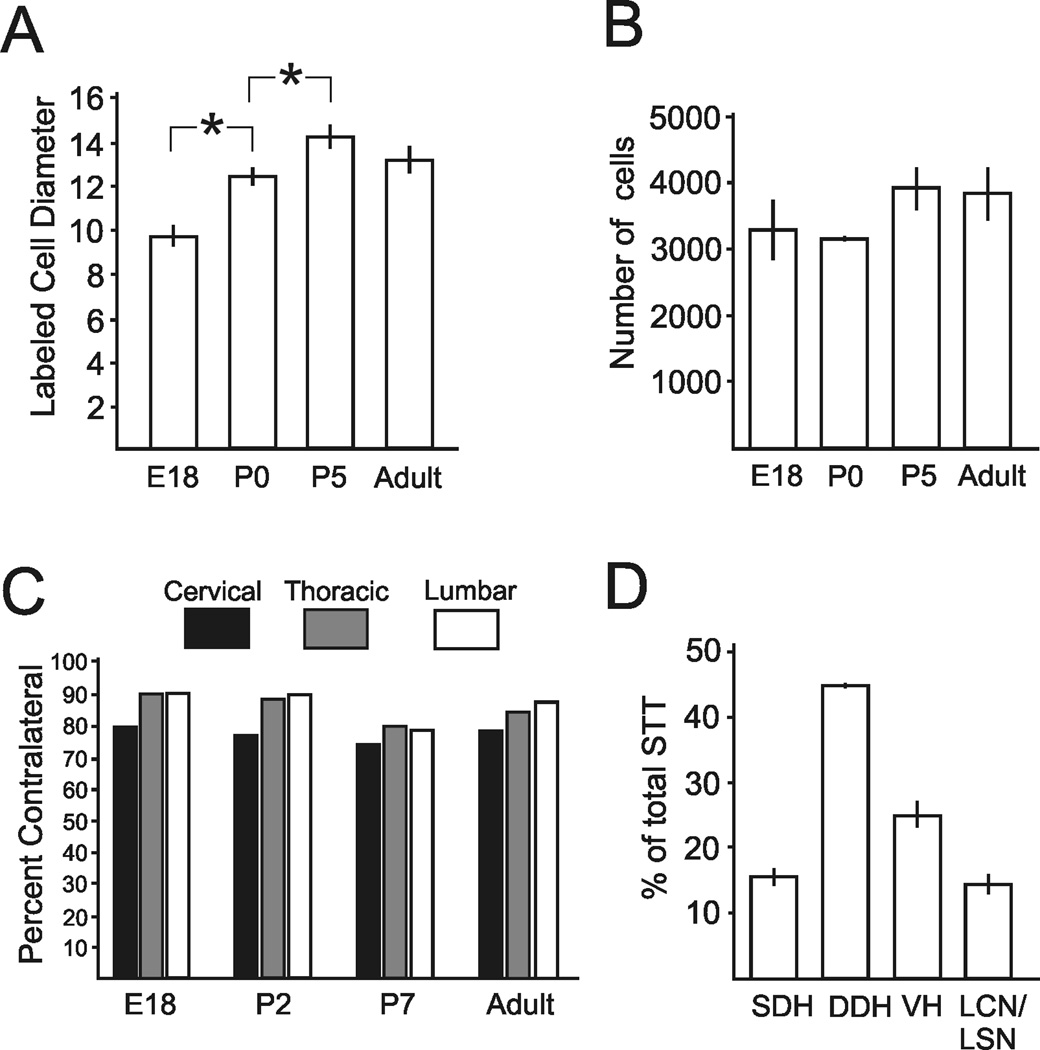
Figure 6.
Measurement and quantification of retrogradely labeled cells. A. Diameters of cells in each age group. Somas of STT neurons progressively increase in size during the early postnatal period and reach adult size at P5. B. No differences were detected between the total mean numbers of corrected STT neurons in each age group. C. Percent of retrogradely labeled cells at each age within cervical, thoracic and lumbosacral levels that were located contralateral to the injection site. D. The percentage of retrogradely labeled neurons in each categorized part of the spinal cord calculated throughout the length of the spinal cord and averaged over each age group.

