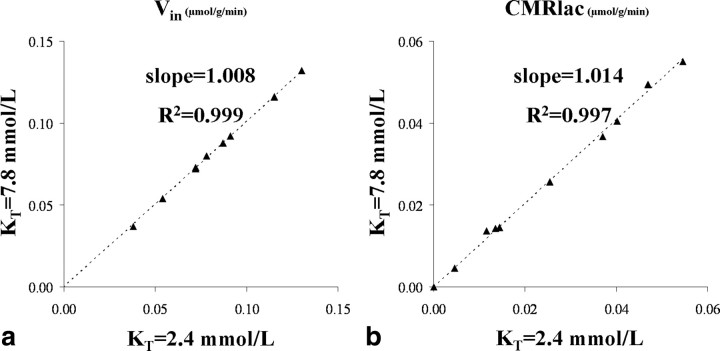
Figure 7.
a, b, Lactate influx values (a) and net consumption of lactate (b) obtained from the dynamic modeling of the data assuming KT being either equal to the mean − SD = 2.4 or mean + SD = 7.8 mmol/L (as determined from the Monte Carlo simulations). The impact observed on the estimated Vin and CMRlac values is negligible as illustrated by the slopes (∼1.01) and R2 coefficients (>0.99) of the linear regressions.

