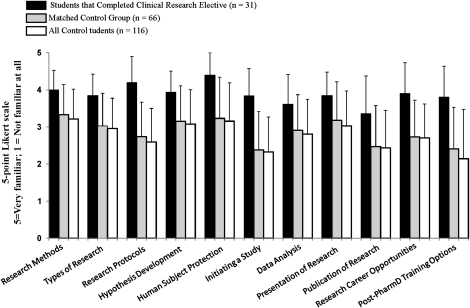
Figure 1.
Familiarity with research topics was compared between students who completed the research elective (n = 31), and those who did not (n = 116). Students indicated their familiarity with the following research topics. The bar represents the mean (SD) familiarity level, based on a5-point Likert scale with 5 = very familiar; 1 = not at all familiar. All statistical comparisons of the matched control group or entire control group versus students who completed the elective resulted in p < 0.05.

