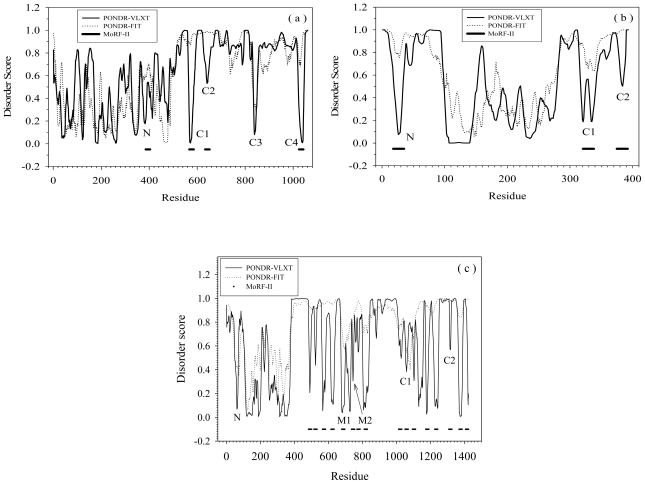
Figure 1.
Disorder and MoRF prediction for (a) RNase E, (b) p53, and (c) SRC-3. The thin solid lines are prediction of PONDR-VLXT, dotted lines are prediction from PONDR-FIT, and horizontal bold lines are the MoRF regions identified by MoRF-II predictor. In subset (a), N and C1–C4 correspond to one N-terminal dip and four C-terminal dips of RNase E. In subset (b), N, C1, and C2 stand for N-terminal dip and two C-terminal dips for p53. In (c), there are one N-terminal dip N, two middle-region dips M1 and M2, and two C-terminal dips C1 and C2.

