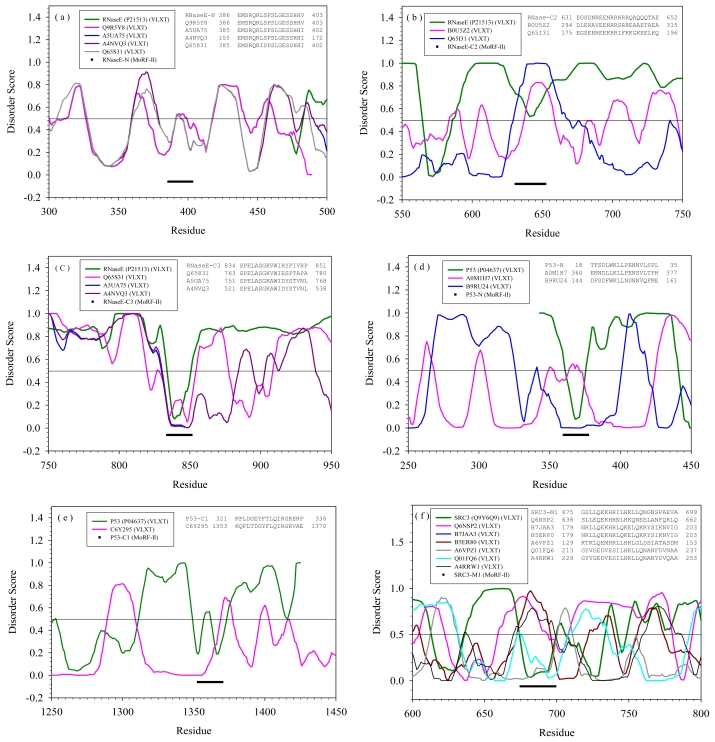
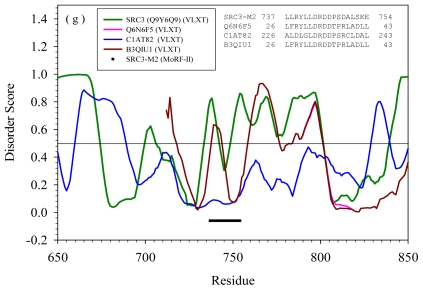
Figure 2.
Disorder prediction and sequence alignment for proteins shown in Table 1, which are alignment matches of all the MoRF regions of three proteins in our study. The alignment was cut off at E-value of 0.001. The disorder prediction was implemented by PONDR®VL-XT. The partially sequence alignment is shown as the inset. The insertions in the original alignment were deleted for matching the curve of disorder prediction. The curves of disorder score were shifted to overlap the aligned segments. The N, C2, and C3 MoRF regions of RNase E are shown in (a), (b), and (c), respectively. (d) and (e) are the N and C1 MoRF regions of P53. (f) and (g) are the M1 and M2 MoRF regions of SRC-3.


