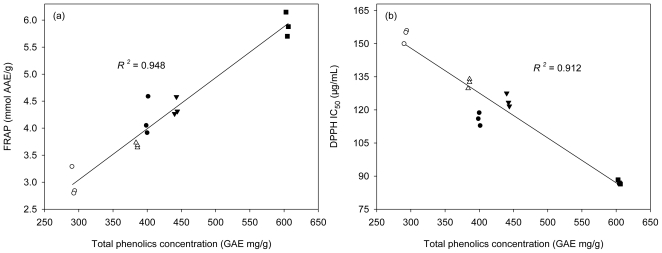
Figure 3.
Correlation between the total phenolics concentration and the ferric reducing power (A); the total phenolics concentration and the free radical scavenging activity (B) of the extract/fractions of the hypocotyls of K. candel. Symbols: black circles = 70% AE, white circles = PF, black triangles = EF, white triangles = WF, and black quadrangle = LF.

