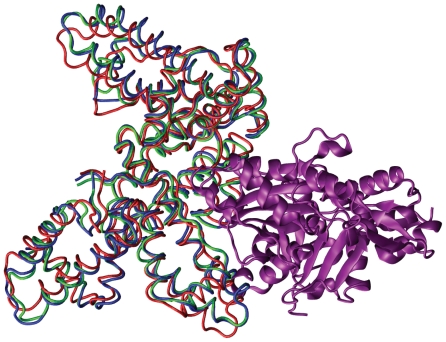
Figure 9.
The complex, 1KXP, between actin (purple) and vitamin D binding protein (VDBP) in the bound (green) and unbound (red) conformations. A fitted structure (blue), obtained by linear regression to the VDBP unbound to bound transition, using 20 normal modes as a basis, has a Cα RMSD of 0.87 Å compared to an initial RMSD of 2.12 Å. This corresponds to the closest structure to the bound that is attainable using the 20 lowest non-trivial normal modes.

