
Figure 2.
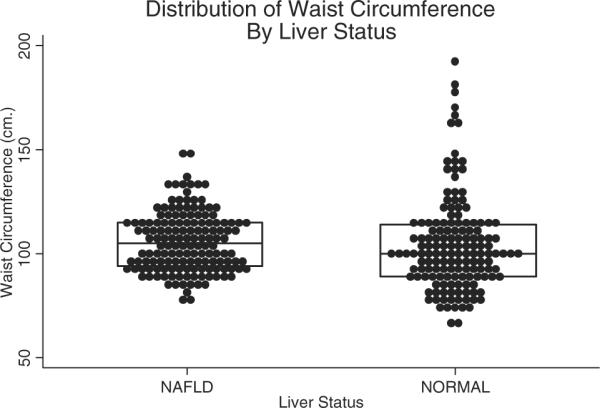
Distribution of waist circumference among obese youth with and without NAFLD. Lines and boxes represent the median and interquartile ranges.
Official websites use .gov
A
.gov website belongs to an official
government organization in the United States.
Secure .gov websites use HTTPS
A lock (
) or https:// means you've safely
connected to the .gov website. Share sensitive
information only on official, secure websites.
Distribution of waist circumference among obese youth with and without NAFLD. Lines and boxes represent the median and interquartile ranges.