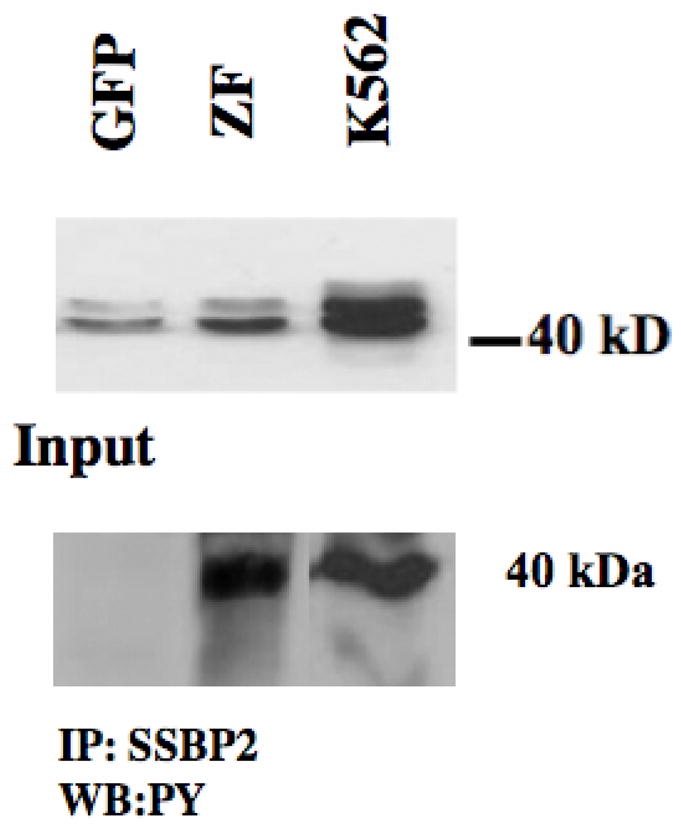
Figure 1.

Analysis of SSBP2 protein phosphorylation in ZNF198-FGFR1 expressing cells. Western blot analysis of 293 cells shows a doublet at 40kDa in cells expressing the empty vector and the fusion kinase (ZF). High level expression is seen in K562 cells which is included as a positive control. When lysates from the same cell lines are used in IP studies using anti-SSBP2 antibodies and probed with anti-phosphotyrosine, the 40 kDa protein is seen only in the ZF cells and K562 control cells and not 293 cells expressing the empty vector.
