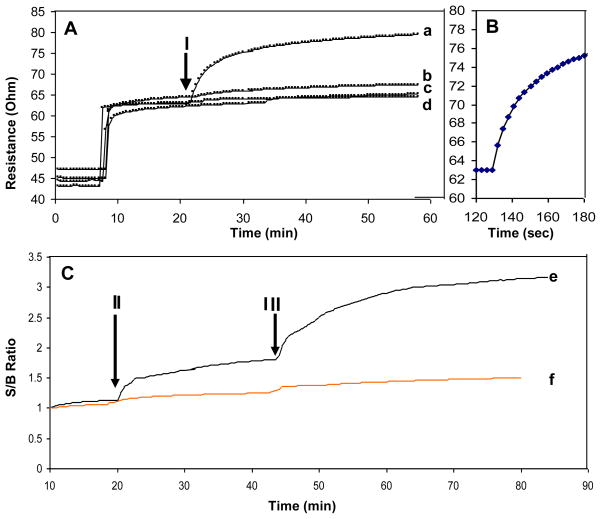
Figure 4. Real-time detection of SEB.
A. BSC Continuous monitoring mode. B. Enlarged section of the period after SEB injection and C. sandwich immunoassay detection of the captured SEB on the BSC. In these experiments the samples were applied to BSC (arrow I) composed of 1 mg/ml SWNT with immobilized anti-SEB IgG and the resistance was plotted. For curve a, 100 ng/mL SEB; (b), 1 ug/mL BSA; (c) 1 ug/mL lysozyme; (d) 1 ug/mL IgG were applied to the sensor. To show the rapid response of BSC, one minute monitoring is shown in B. To demonstrate that SEB is actually bound to the BSC, after SEB injection (II) a second anti-SEB IgG was injected (III) and the signal to baseline (S/B) was plotted. In the presence of SEB (e) a signal is detected. Such signal not detected in the control (no SEB) (f).

