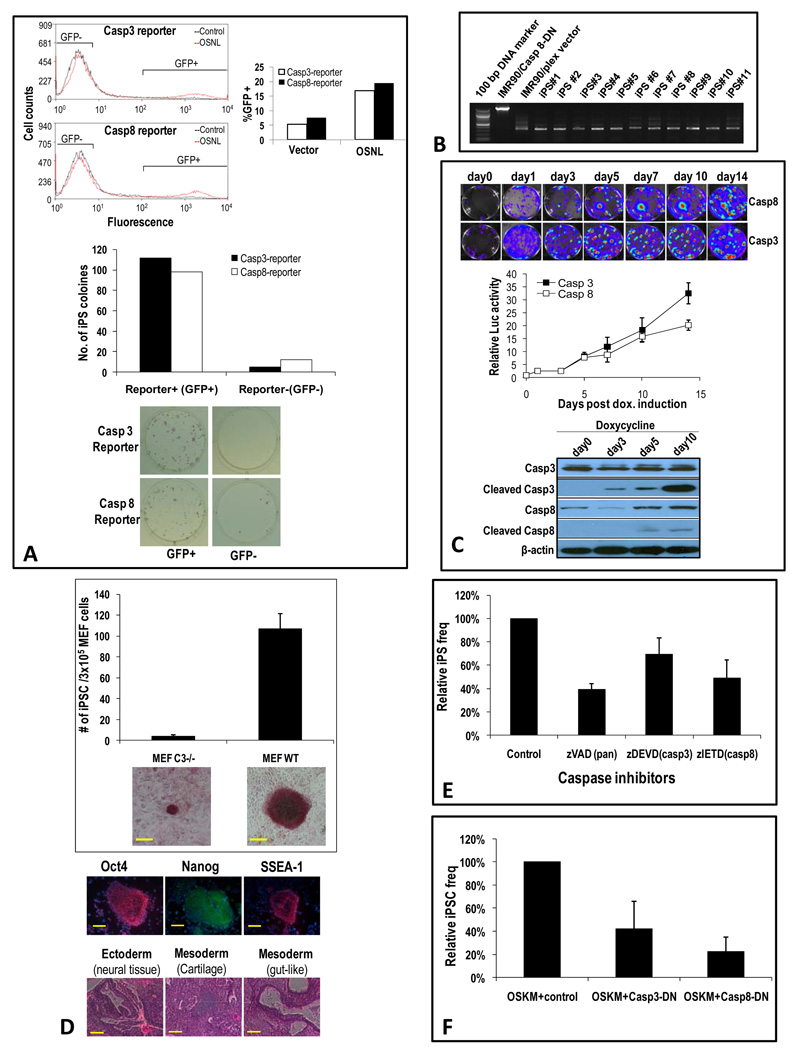
Figure 4. The effect of caspase 3 and 8 activation on iPSC formation in OSNL-transduced IMR-90 cells.
A) Positive correlation of iPSC formation frequency with activated caspases. Top panel, FACS profile of IMR90 cells stably transduced with caspase 3 and 8 reporters and subsequently infected with lentiviral vectors encoding OSNL. Shown are FACS profiles at 3 days after OSNL transduction. Reporter positive and negative cells (as indicted by brackets in the FACS profiles) were then sorted and plated onto feeder cells at 9×10⁴ cells/well in 6-well plates. Middle panel, frequencies of iPSC colonies from caspase+ and caspase- cells. Lower panel, alkaline phosphatase staining of iPSC colonies after 3 weeks of culturing.
B) Cell-intrinsic requirements for caspase 8 activation in the iPSC induction process. IMR90 cells transduced with either a control lentiviral vector (pLEX) or the same lentiviral vector encoding a dominant negative caspase 8 (casp8-DN) were mixed at a ratio of 1:9, infected with OSNL, and then plated onto feeder cells. Twenty days later, eleven randomly chosen iPSC colonies from the OSNL-transduced cells were picked and analyzed by PCR for the presence of either the control vector or casp8-DN.
C) Activation of caspases 3&8 in iPSC induction from murine fibroblast cells. Murine tail tip fibroblast transduced doxycycline-inducible OSKM were transduced with caspase 3 or 8 reporters. Reporter activation was then observed at different times after doxycycline addition. Top panel: representative images of reporter activities. Middle panel: quantitative plot of reporter activities. Error bars represent SEM (n=3). Lower panel: western blot analysis of total and activated caspases 3&8 in doxycycline treated cells.
D) iPSC colony formation from wild type and caspase 3−/− MEF cells. MEF cells were transduced with OSKM and evaluated for iPSC colony formation through AP staining 20 days later. Right panel, quantitative data showing average iPS colony numbers from triplicate plates. Error bars represent SEM (n=3). Representative AP staining of iPSC colonies from wild type and casp3−/− MEF cells were also shown. Scale bars represent 200 µm. Top right panels, verification of the stemness of putative iPS colonies through immunofluorescence staining of typical ESC markers. Lower right panel: formation of three germ layers in terotomas formed in nude mice from select wild type MEF cells.
E) Relative frequency of iPSC induction from MEF cells in the presence of chemical caspase inhibitors. The concentrations of the inhibitors used are at 5 µM. For control a structurally similar but non-inhibitive compound was used. Error bars represent SEM (n=3).
F) Relative frequency of iPSC Induction from MEF cells in the presence of dominant-negative caspase 3&8 genes. Error bars represent SEM (n=3).

