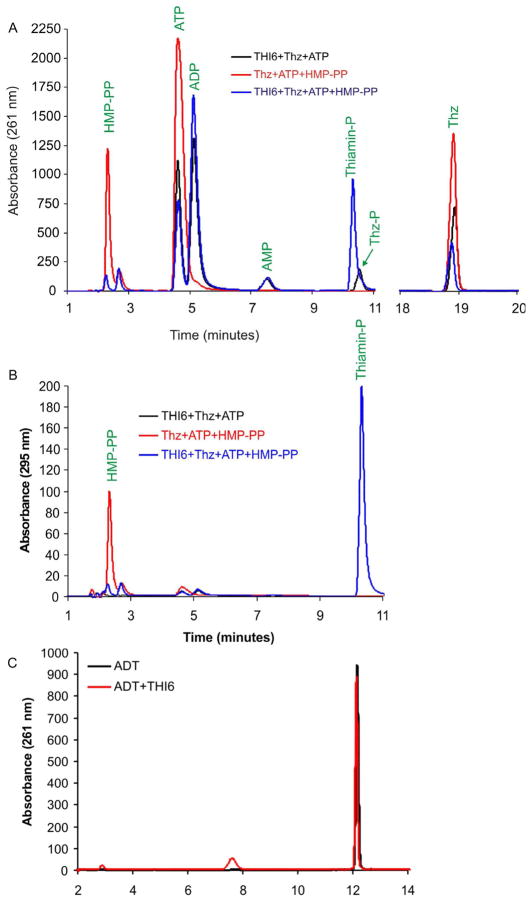
Figure 4.
Activity assays for CgTHI6. (A) HPLC analyses of the TPS and ThiM activities, absorbance measured at 261 nm. The red trace shows the control where the enzyme is not added. The black trace shows the Thz-P formation in presence of the enzyme showing the ThiM activity. The blue trace shows the ThMP formation in presence of the enzyme showing the TPS activity. (B) HPLC analyses of the TPS and ThiM activities, absorbance measured at 261 nm. The red trace shows the control where the enzyme is not added. The black trace shows the Thz-P formation in presence of the enzyme showing the ThiM activity. The blue trace shows the ThMP formation in presence of the enzyme showing the TPS activity. (C) HPLC analysis of ADT cleavage activity, absorbance measured at 261 nm. The red trace shows the control where the enzyme is not added. The black trace shows that there is no reaction in presence of the enzyme.

