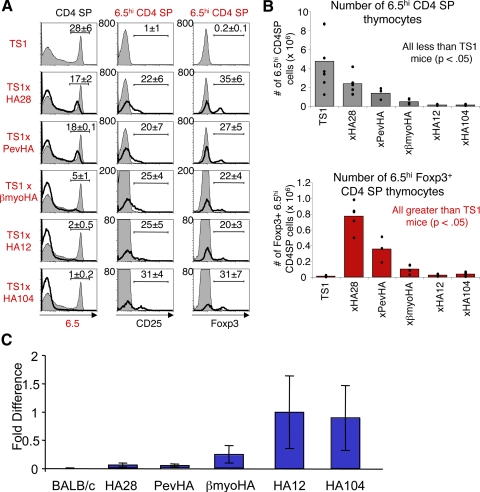
Figure 1. The S1 self-peptide induces thymocytes expressing the 6.5 TCR to undergo deletion and Treg formation in TS1 × HA mice.
(A) Histograms show 6.5 expression by CD4SP thymocytes (left panels) and CD25 expression (middle panels) or Foxp3 expression (right panels) by 6.5hiCD4SP thymocytes from the indicated TS1 × HA (black lines) mice, overlaying TS1 (filled) mice, with mean percentages indicated. (B) Graphs show numbers of 6.5hiCD4SP thymocytes (upper graph) and of 6.5hiCD4SPFoxp3+ thymocytes (lower graph) from indicated TS1 × HA mice. Bars denote means, and individual values are indicated (●). (C) Graph shows relative amounts of HA transgene mRNA in total thymic mRNA preparations from indicated lineages of HA transgenic mice as determined by real-time PCR. Bars indicates means ± sem.

