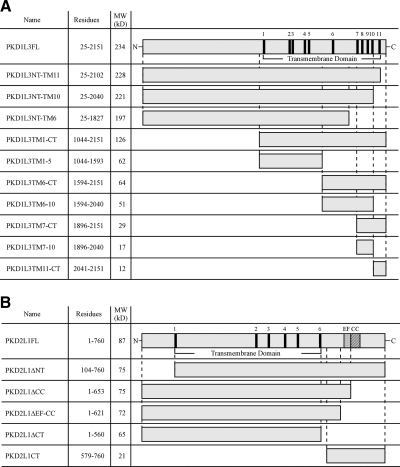
Figure 1.
Schematic representation of the domain organization of PKD1L3, PKD2L1 and their deletion constructs. Schematic representations show the PKD1L3 (A) and PKD2L1 (B) deletion constructs tested in this study. Black boxes indicate predicted transmembrane (TM) domains. EF, Ca2+-binding EF-hand domain; CC, coiled-coil domain.

