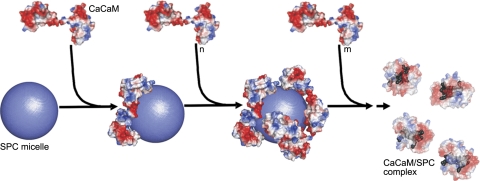
Figure 9.
Stoichiometry-dependent binding model for the Ca2+CaM–SPC interaction. The SPC micelle is represented as a sphere with a radius of 30 Å. Molecular surfaces are colored according to surface charge distribution (red, negative; blue, positive). First process (steps 1 and 2): Ca2+CaM molecules bind to the positively charged micelle. Electrostatic interaction with the acidic CaM regions is important in this phase. Second process (step 3): Saturation of the micelle surface with protein molecules will eventually result in the disintegration of the micelle and Ca2+CaM adopting a collapsed conformation (transparent view) embracing several SPC monomers (gray). In this phase, hydrophobic interactions play an important role in complex formation. The exact mechanism by which the protein disintegrates the micelle is unknown, as depicted by the dashed arrow. Crystal structures of Ca2+CaM (PDB structure 1UP5) and Ca2+CaM/SPC (PDB structure 3IF7) were used for modeling the complexes. Note that while the Ca2+CaM–SPC micelle complex is only a model, the structure of the resulting Ca2+CaM/SPC complex has been determined by X-ray crystallography. The figure was prepared using PyMol (DeLano Scientific).

