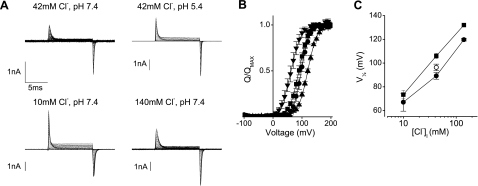
Figure 4.
Effects of altering internal [Cl−] and pH. A) Representative currents from cells expressing E268A CLC-5 using different intracellular solutions as indicated. B) Charge-voltage relationships of the QOFF currents in control solutions (■), when internal pH was lowered from 7.4 to 5.4 (●), or when internal [Cl−] was lowered and raised from 42 to 10 mM (▾) and 140 mM (▴), respectively. Fitted curves are Boltzmann functions. C) Plot of the fitted half-maximal V1/2 values vs. intracellular [Cl−] at pH 7.4 (♦) plus the value obtained with 42 mM Cl− when pH was lowered to 5.4 (○). V1/2 values obtained from the conductance-voltage plots of wild-type CLC-5 currents (see Supplemental Fig. 4) with the same solutions are indicated (■). Data are expressed as means ± se of ≥5 different cells.

