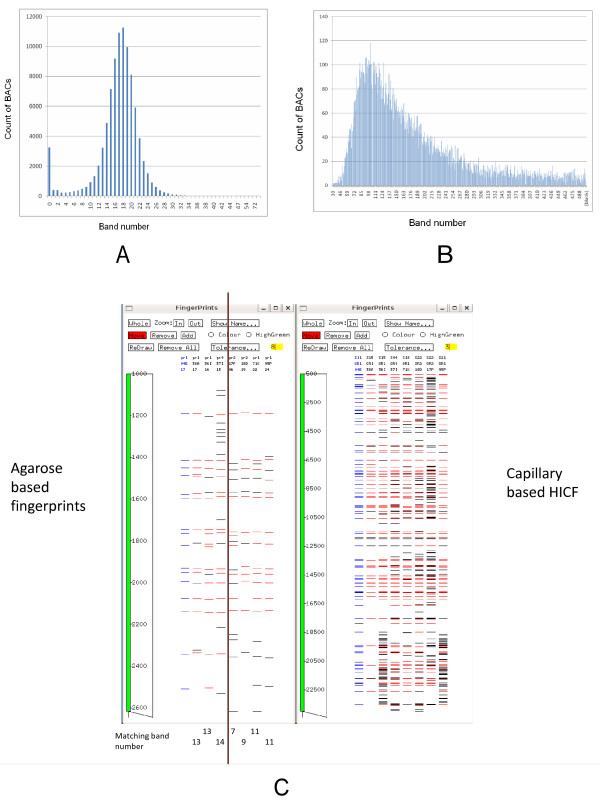
Figure 1.
Comparison of band number distribution between agarose-based fingerprints and HICF. A: agarose-based fingerprints; B: HICF; C: an example of two agarose FPC contig joined in HICF. Red bands are matching bands to the highlighted (in blue) BAC. Counts of matching bands to the BAC are listed below each lane. The four BACs on the right were not assembled into the same contig.

