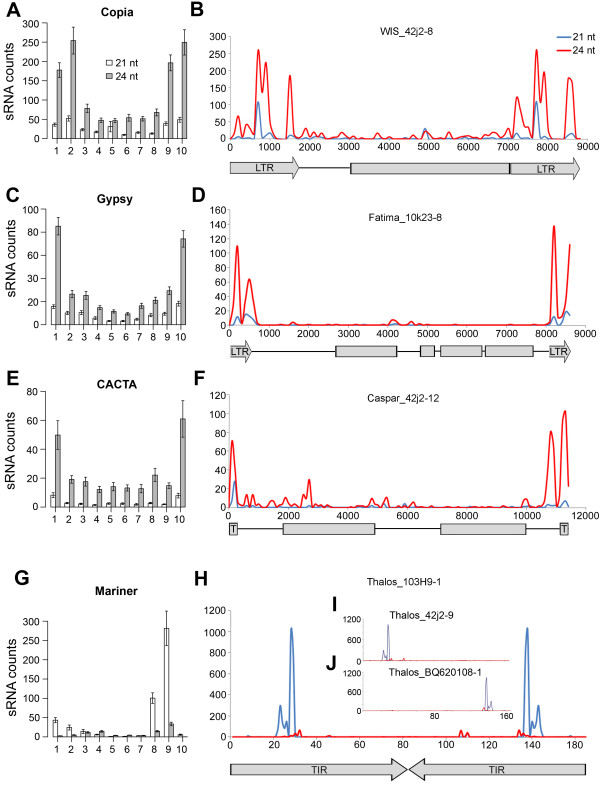
Figure 5.
Distribution of sRNAs within TEs. The nucleotide sequence of each element of the Copia, Gypsy, CACTA and Mariner superfamilies present in the complete TREP database were divided in ten fractions, each representing 10% of the total element. (A, C, E, G). Bar graphs represent the mean number of total sRNAs that perfectly matched each of the ten fractions within each TE superfamily. Bars represent standard errors of the means.
(B, D, F, H) Distribution of perfectly matching sRNAs in representative elements from each TE superfamily. A graphical representation of the elements is provided below each graph; arrows and boxes correspond to repeats and open reading frames, respectively. (I, J) Distribution of perfectly matching sRNAs in MITEs with mutations in the 5' (I) and 3' (J) regions.

