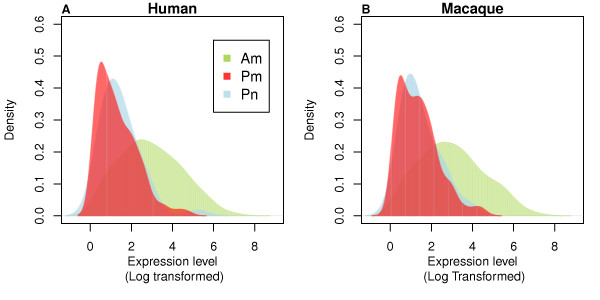
Figure 1.
Expression levels of conserved annotated and putative miRNA. Distribution of expression levels (base-10 logarithm transformed) of conserved annotated miRNA (Am/green), conserved putative miRNA, excluding the ones originating from ncRNA (Pm/red), and conserved putative miRNA originating from ncRNA (Pn/blue) in humans (A) and rhesus macaques (B).

