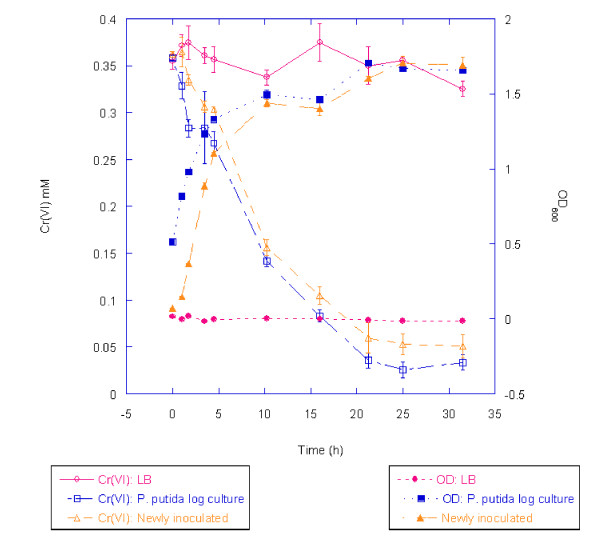
Figure 2.
Chromate reduction by P. putida F1. The progression of reduction of 0.3 mM K2CrO4 by P. putida F1 in LB broth is shown over a 31.5 h period. At T = 0, F1 cells were either freshly inoculated into the chromate-containing growth medium from an overnight culture to an OD of 0.07 (open triangles) or chromate was added to a culture of F1 already in mid-log phase (open squares). The abiotic control is also shown (red open circles). Each data point represents the mean of three replicate measurements. Error bars indicate one standard deviation.

