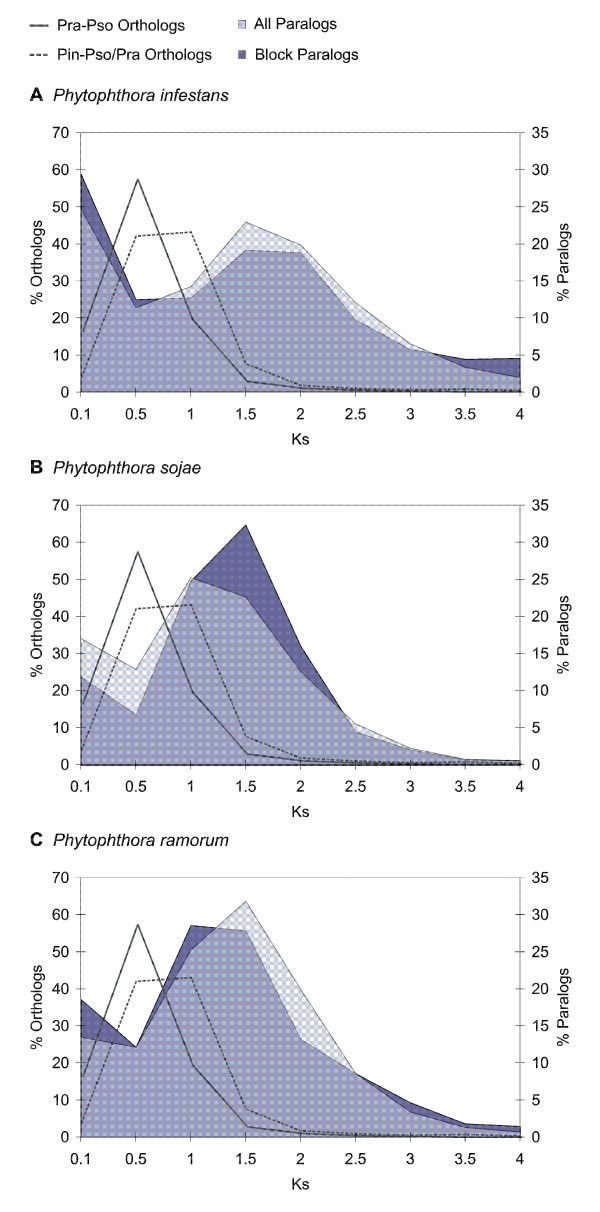
Figure 4.
KS dating of the Phytophthora duplication and speciation events. KS distribution for paralogous and orthologous genes in the (A) P. infestans, (B) P. sojae and (C) P. ramorum genome. The KS distribution for the P. sojae (Pso) and P. ramorum (Pra) orthologs (left Y-axis), representing the P. sojae-P. ramorum speciation, is indicated by a full grey line. The KS distribution for the P. sojae (or P. ramorum) and P. infestans (Pin) orthologs (left Y-axis), representing the P. infestans-P. sojae/P. ramorum speciation, is indicated by a grey dotted line. The KS distribution of the whole paranome (right Y-axis) is shown in light blue shading; the KS distribution of the paralogs located in duplicated blocks (right Y-axis) is indicated in dark blue shading.

