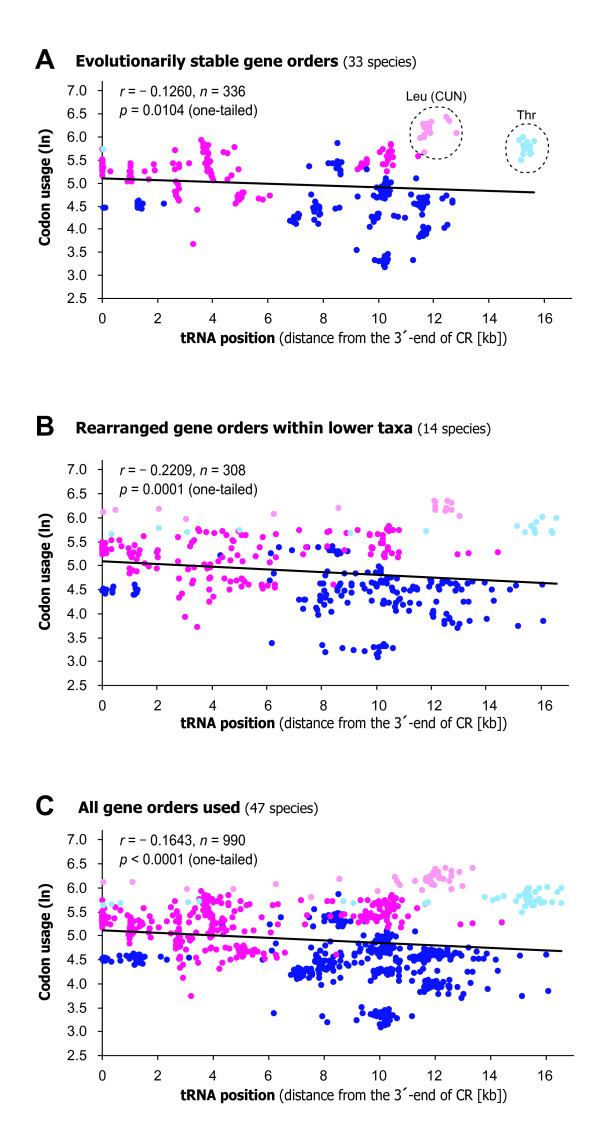
Figure 3.
A linear regression plot between position of tRNA genes and usage of the corresponding codon. The data points were derived from an independent contrasts analysis using the program CAIC [11] based on vertebrate mt-genome sequences from (A) 33 species with evolutionarily stable gene order, (B) 14 species with rearranged gene orders within lower taxa, and (C) all of the 47 species selected (Table 2) and recent molecular phylogenies for vertebrates (supplementary Fig. S2 [see Additional file 1]). Data points for the tRNA genes that specify hydrophobic and hydrophilic amino acids are colored magenta and blue, respectively; exceptionally, the data points for the tRNA-Leu (CUN) and tRNA-Thr are colored light pink and light blue, respectively. The regression lines were derived from the all data points in each plot. When the tRNA genes of H-strand and L-strand were analyzed separately, the correlation remained negative for either of the strands (data not shown).

