
Figure 3.
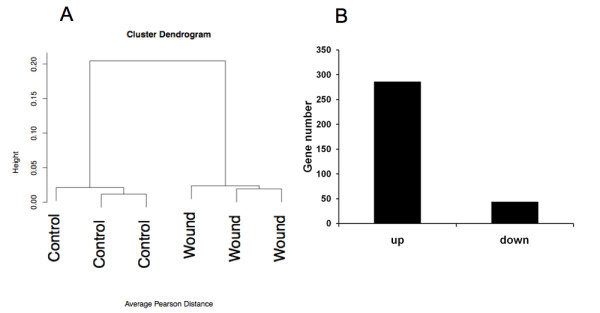
Global analysis of the transcriptomic data. Panel A displays hierarchical clustering of the wounds versus the control microarray results. In panel B, the quantitative representation of up and down-regulated genes in granulation tissue in comparison with control tissue is displayed.