
Figure 7.
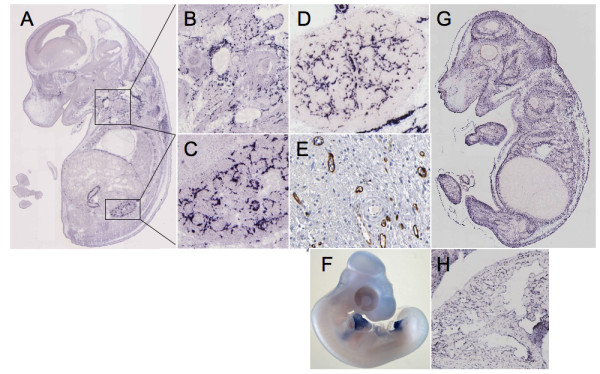
Analysis of selected genes by in situ hybridization. The expression patterns of FABP4, as analyzed by in situ hybridization of mouse E14.5 embryo, are displayed in panels A, B and C and the same for EMP-1 in panels F and G. Panels C and D, for direct comparison, show the expression patterns of FABP4 and CDH5 respectively in kidney. Panel E shows the expression profile of FABP4 in vessels of the urinary bladder as analyzed by immunohistochemistry. Panel G portrays the expression of EMP-1 in the endocard of an E14.5 embryo (in situ hybridization). Panel H depicts the expression of TCF21 in the E23 chick embryo (in situ hybridization).