
Figure 3.
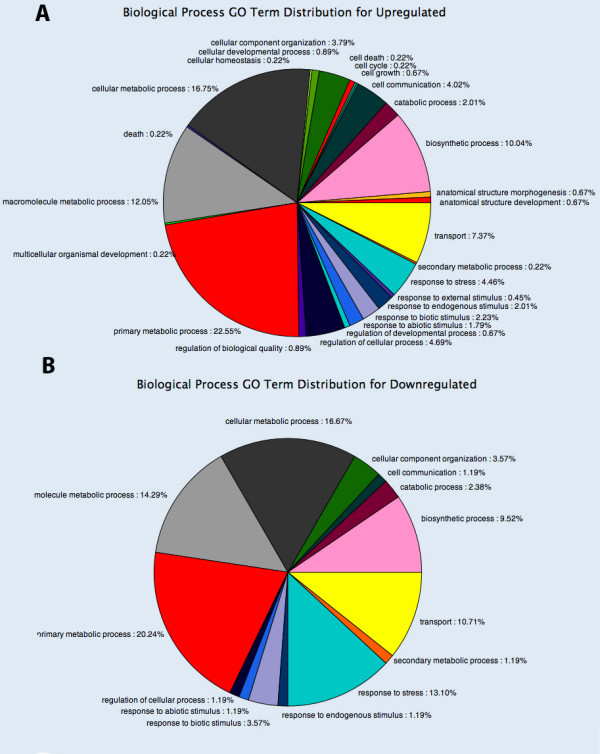
Distribution by biological processes involved of differentially expressed genes in the ripe receptacles of F. xananassa compared to F. vesca. A) Distribution by biological processes of genes with higher expression in the ripe receptacle of F. xananassa. B) Distribution by biological processes of genes with lower expression in the ripe receptacle of F. xananassa. The analysis was performed in genes that were differentially expressed over 4-fold, and passed the t-test and FDR (Benjamini-Hochberg) for multiple testing corrections with a confidence p-value < 0.1. Distribution was by Biological Processes among those genes with associated GO terms according to the Blast2-GO software (level 3).