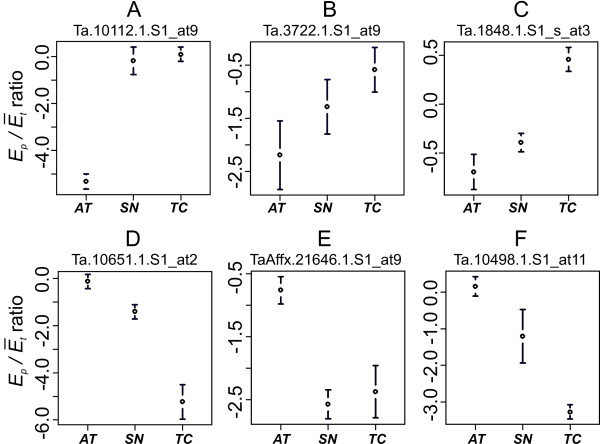
Figure 4.
Ep/Ēt ratio estimates in AT, SN and TC for selected PSFs. The graphs are showing the means and 95% confidence intervals of Ep/Ēt ratio estimates. The top three probes hybridize preferentially with TC (TC-specific); the bottom three probes hybridize preferentially with AT (AT-specific). The names of PSF probes are indicated on the top of each plot.

