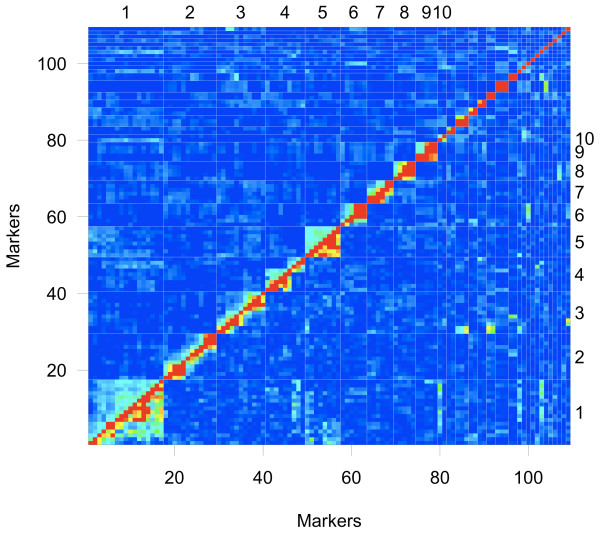
Figure 2.
Pair wise recombination fractions and LOD scores. Marker (below and left side) and linkage group (above and right side) numbers are at identical positions as in the Figure 1. Above the diagonal; recombination fractions and below the diagonal; corresponding LOD scores. Red indicates high values and blue indicates low values. Green LOD scores are close to significant values.

