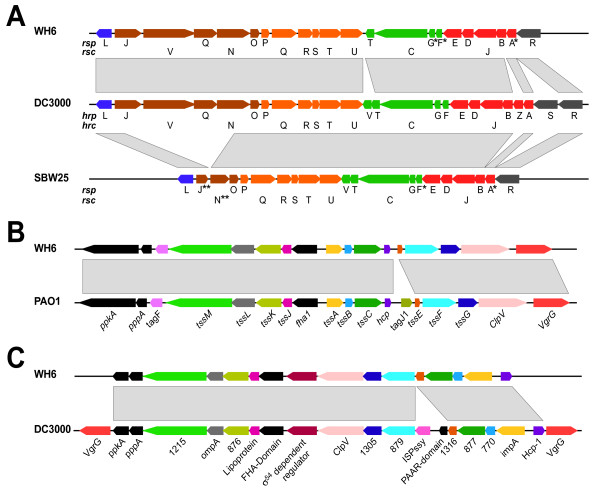
Figure 6.
Schematic Representations and Comparisons of Type III and Type VI Secretion Systems. A) The type III secretion system of WH6 (top) compared to that of P. syringae (middle), and SBW25 (bottom). Co-transcribed genes and orthologous transcriptional units are colored similarly. *No detectable homology but inferred based on location in the T3SS-encoding locus. **Truncated coding regions. B) The type VI secretion system-1 of WH6 (top) compared to HSI-I of P. aeruginosa PAO1. C) The type VI secretion system-2 of WH6 (top) compared to a candidate type VI secretion system of P. syringae pv tomato DC3000 (bottom). Orthologous transcriptional units are colored similarly. For A-C, the directions of transcription are represented. Gray boxes highlight homologous regions.

