Fig. 1.
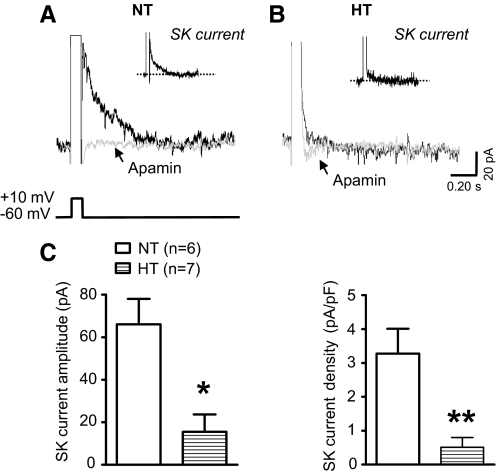
Comparison of SK current among PVN-RVLM neurons from NT and HT rats. A: representative traces from a neuron of a NT rat showing outward tail current following step (100 ms) depolarization of Vm (−60 to +10 mV) in the absence (black trace) and presence (gray trace) of apamin (100 nM). B: outward tail current in a neuron from a HT rat in the absence (black trace) and presence (gray trace) of apamin (100 nM). Note: Insets in A and B show the net SK current obtained by subtraction (control - apamin). C: summary data show the amplitude (left) and density (right) of SK current for cells in each treatment group. All recordings were performed with TTX (0.5 μM) and TEA (1.0 mM) in the bath and with 8-(4-chlorophenylthio) 3′,5′-cyclic adenosine monophosphate (8CPT-cAMP, 50 μM) in the intracellular solution. *P < 0.05, **P < 0.01 vs. NT (unpaired Mann-Whitney test).

