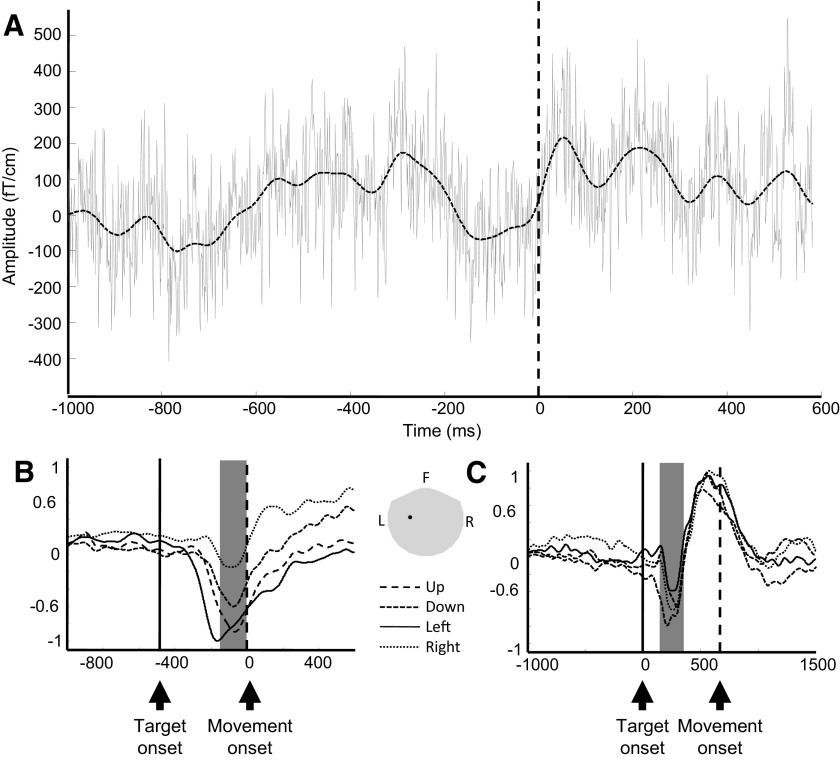
Fig. 2.
Effects of signal smoothing (A) and magnetoencephalography (MEG) signal modulation by movement directions (B and C) for 1 MEG sensor (gradiometer) above the contralateral sensorimotor area. Data were collected from subject S1. A: raw MEG trace (solid gray line) overlaid by its smoothed version (dashed black line) during a single overt trial. Time 0 represents movement onset. B: each trace represents the average of smoothed signals of all repetitions for each movement direction for 1 subject. Data were aligned to movement onset (time 0, vertical dashed line). The vertical solid line indicates average target onset time. The 4 traces were normalized to the maximum of absolute amplitude. There is a clear downward deflection of MEG signals ∼100–200 ms before movement onset. The amplitude of this downward deflection varies across different movement directions. Furthermore, the gray area indicates the average time window used for sensor-space decoding analysis (time of interest) across all subjects. C: same as B, except that the data were from imagined movement and aligned to target onset (time 0, vertical solid line). The vertical dashed line indicates average movement onset time. Position of this MEG sensor is shown in the inset, and the gray area represents the whole head helmet. F, front, L, left, R, right.

