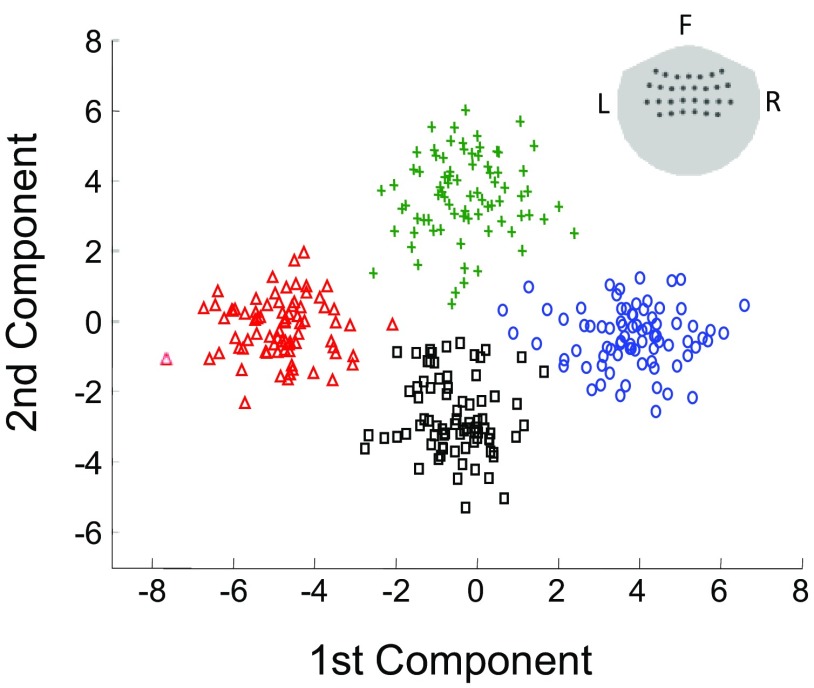
Fig. 3.
Modulation of MEG responses examined in 2-D space using the first 2 components of linear discriminant analysis (LDA). The LDA analysis projects activities of all MEG sensors above the sensorimotor area (sensor positions shown in the inset) into a low-dimensional space, where modulation of MEG responses by intended movement direction can be easily visualized. The figure shows a 2-D projection of single-trial MEG responses averaged over −200 to 0 ms relative to movement onset (subject S1). They clearly form 4 distinct clusters corresponding to 4 different intended movement directions. The green plus signs, black squares, blue circles, and red triangles represent single-trial MEG responses for movement in the up, down, left, and right directions, respectively.

