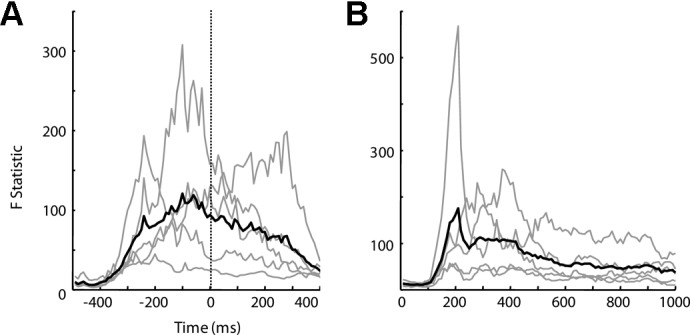
Fig. 7.

Temporal dynamics of cortical activity modulation by movement direction. The source-space multivariate ANOVA (MANOVA) test was performed in 10-ms intervals to characterize movement modulation of cortical activity, and the resulting F statistics were plotted as a function of time for overt (A) and imagined (B) movements. P value of 10−5 approximately corresponds to an F statistic of 25.3. Thin gray lines represent the F statistics for individual subjects (nondelay task), and the thick black lines represent the average over all subjects. Cortical activity becomes highly modulated right before movement onset for overt movement and 300–400 ms after target onset for imagined movement.
