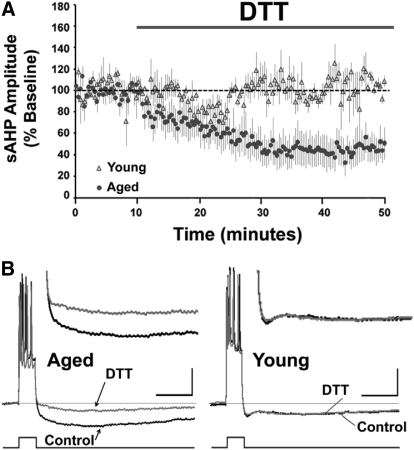
Fig. 1.
Age-dependent reduction in the sAHP by DTT. (A) Time course of the change in the normalized sAHP amplitude in the aged (filled circles) (n = 5) and young (open triangles) animals (n = 3), following application of DTT for 40 min. (B) Representative traces illustrating the change in the AHP of aged (left) and young (right) animals under control conditions and at the end of 40 min application of DTT. The line beneath the traces indicates the onset and offset of the step current used to elicit a train of 5 action potentials. In this and subsequent figures, the faint line within the traces represents the baseline. Calibration bars: 200 ms, 10 mV. Inset: Magnified representation of change in the aged and young AHP under control condition, and 40 min after DTT application.

