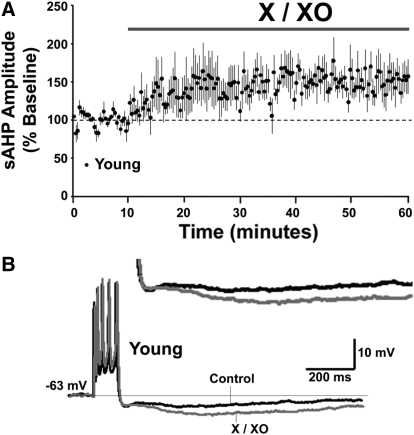
Fig. 2.
Oxidizing agent decreases sAHP in young animals. (A) Time course of the change in the normalized sAHP amplitude in young animals (n = 5), following application of X/XO for 50 min. (B) Representative traces illustrating the change in the AHP for a young animal under control conditions (black trace) and at the end of 50 min application of X/XO (gray trace). Calibration bars: 200 ms, 10 mV. Inset: Magnified representation of change in the young AHP under control condition, and 50 min after X/XO application.

