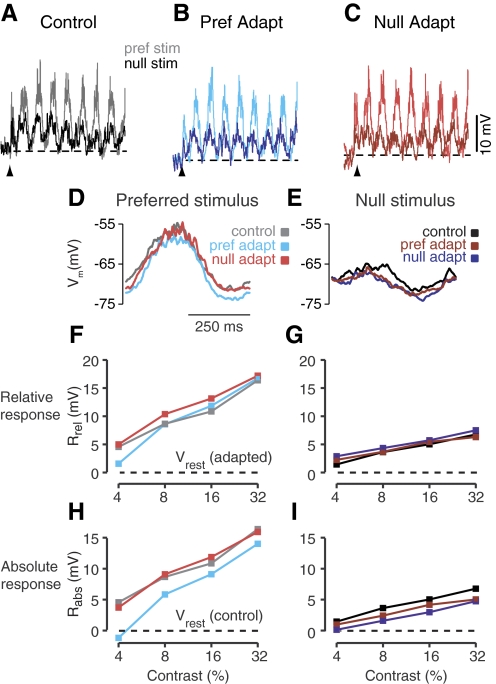
Fig. 2.
Effects of prolonged stimulation on a simple cell. Average responses to drifting gratings in the preferred (light traces) and opposite (dark traces) directions after no visual adaptation (A), prolonged visual stimulation in the preferred direction (B), or prolonged visual stimulation in the opposite (null) direction (C). The resting membrane potential for each adaptation condition is indicated by the black dashed lines. Upward pointing arrows indicate the beginning of visual stimulation. D and E: contrast-response curves for the six stimulus conditions: preferred and null direction stimuli after adaptation to a blank stimulus, to the preferred direction, or to the null direction. Responses are measured as the peak depolarization (F1+DC) relative to the adapted resting potential (Rrel). F and G: same as D and E for the peak depolarization measured relative to the unadapted resting potential (Rab).

