Fig. 1.
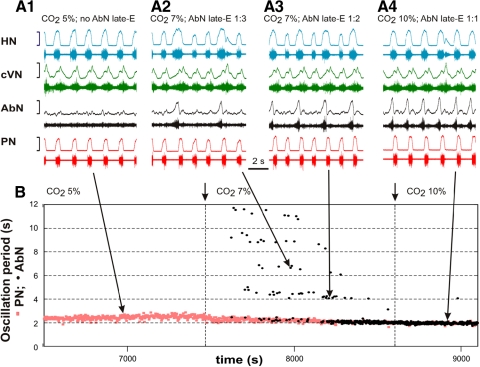
Quantal acceleration of late-expiratory (late-E) abdominal activity with the development of hypercapnia (increase in the CO2 concentration in the perfusate). A, 1–4: simultaneously recoded activity of (bottom-up) phrenic (PN, red), abdominal (AbN, black), cervical vagus (cVN, green), and hypoglossal (HN, blue) nerves. Activity of each nerve is represented by 2 traces: raw recording (bottom) and integrated activity (top). A1: normocapnia (5% CO2): late-E activity is absent in the AbN. A, 2–4: quantal acceleration of AbN activity: with the development of hypercapnia, the ratio between the AbN and PN frequencies goes through step-wise changes from 1:3 and 1:2 (A, 2 and 3, 7% CO2) to 1:1 (A4, 10% CO2). B: time-series representation of the entire experimental epoch with the oscillation periods in the PN (red squares) and AbN (black circles) plotted continuously versus time. The AbN late-E bursts were synchronized with the PN bursts with a ratio increasing quantally from 1:5 to 1:1. The content of CO2 in the perfusate of this preparation was changed at times indicated by short arrows and vertical dashed lines. Large arrows indicate times corresponding to the episodes shown in A, 1–4.

