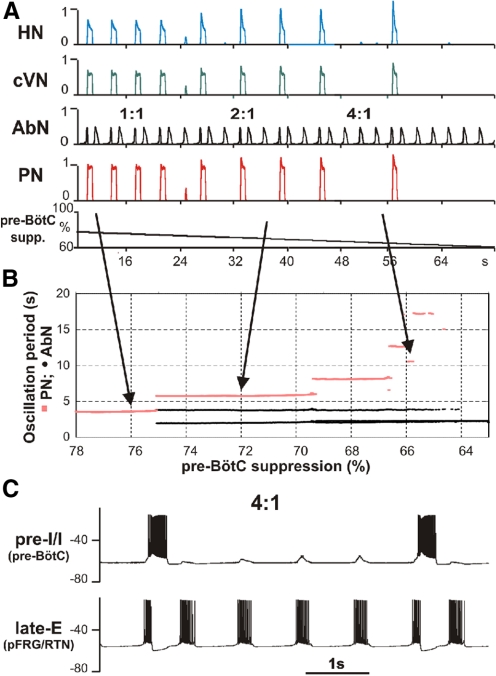
Fig. 11.
Simulation of quantal slowing of PN activity. A: to simulate quantal slowing of PN activity, we 1st set the value of drive to late-E to 0.36 and the value of pontine drive to 0. This regime corresponded to the end of the simulation shown in Fig. 10 with a biphasic-E pattern of AbN activity. Then the excitability of the pre-BötC neurons [in both the pre-I/I and early-I(1) populations] was linearly decreased by a proportional reduction of all weights of excitatory synapses to pre-I/I and early-I(1) neurons (“pre-BötC suppression,” see lower trace, starting with 78% of the basic value and reducing this to 0). During progressive reduction of pre-BötC neuronal excitability, the frequency of PN (and HN and cVN) bursts was quantally reduced with the ratio to AbN frequency jumping from 1:1 to 1:2 and so on (see red steps in B) until the activity of all nerves except AbN was abolished. B: this diagram demonstrates a step-wise dependence of AbN (black circles) and PN (red squares) periods on the pre-BötC's synaptic depression. After the 1st step in PN period (around 75% of normal synaptic weights), 2 different periods of AbN activity were observed. The longer periods correspond to AbN cycles accompanied by PN bursts and the shorter periods correspond to AbN oscillations with PN silent. C: membrane potential traces of single neurons from the pre-I/I population of pre-BötC (bottom traces) and the late-E population of RTN/pFRG (top traces), corresponding to the regime 4:1. Note that the profile of AbN bursts in A and late-E bursts in C changed from the biphasic-E activity to a monophasic burst whenever the PN bursts were missing.

