Fig. 4.
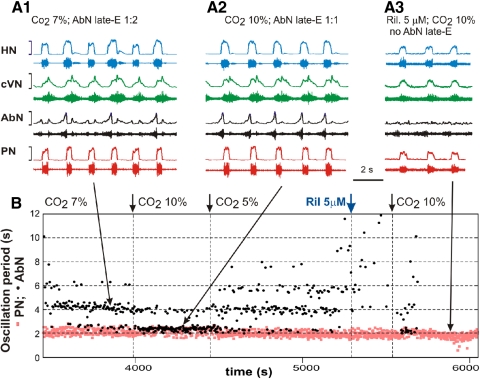
Effect of riluzole on the hypercapnia-induced AbN late-E activity. A, 1–3: simultaneously recoded activity of (bottom-up) PN (red), AbN (black), cVN (green), and HN (blue) nerves. B: representation of the entire experimental epoch by plotting the oscillation periods in PN (red squares) and AbN (black circles) vs. time. A, 1 and 2, and the corresponding parts of the diagram in B (indicated by large arrows) show quantal acceleration of the AbN late-E activity with the development of hypercapnia from 7% CO2 (see in B, left, and A1 showing a 1:2 ratio between AbN and PN frequencies) to 10% CO2 (see in B after 1st small arrow indicating changing CO2 to 10% and in A2 where the ratio of frequencies is 1:1). The level of CO2 then was returned back to 5% (see 2nd small arrow in B) and the frequency of AbN started quantally reducing. Then riluzole (5 μM), the persistent sodium current blocker, was added to the pefusate (indicated in B by blue arrow). The right arrow in B indicates the moment when CO2 was increased to 10% in the presence of riluzole. A3 and B, right, shows that riluzole abolished the hypercapnia-evoked AbN late-E activity while only reducing the amplitude (and frequency) of discharges in other nerves.

